Statistics
Use this screen to manage statistics. A fresh OTRS installation already contains some statistics by default. The statistics management screen is available in the Statistics menu item of the Reports menu.
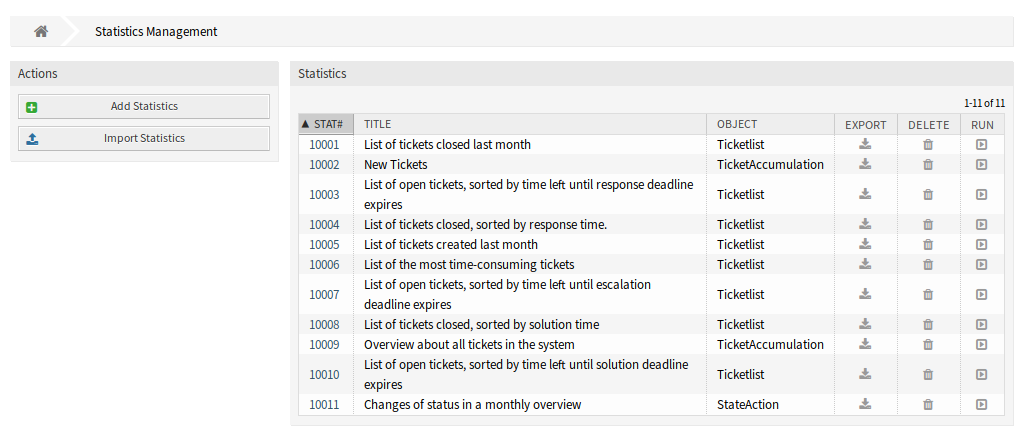
Statistics Overview Screen
Manage Statistics
Three type of statistics are available in OTRS.
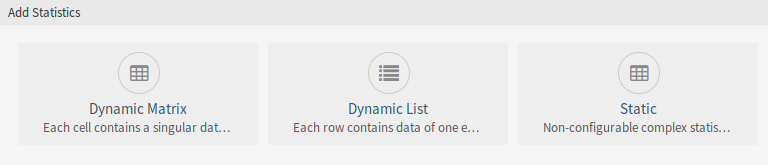
Add Statistics Screen
- Dynamic Matrix
- Each cell contains a singular data point.
- Dynamic List
- Each row contains data of one entity.
- Static
- Non-configurable complex statistics.
To create a new statistics:
- Click on the Add Statistics button in the left sidebar.
- Select the type for the new statistics.
- Fill in the required fields.
- Click on the Save button.
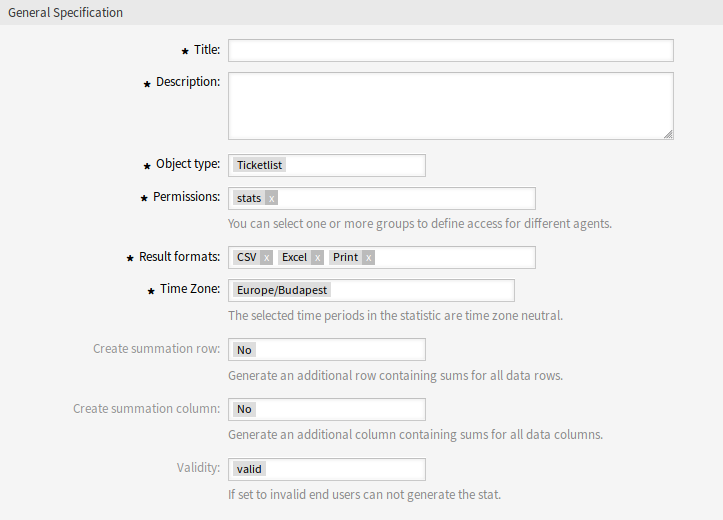
Add General Specification Section
To edit a statistics:
- Click on a statistics number in the list of statistics.
- Modify the fields and the statistics details.
- Click on the Save or Save and finish button.
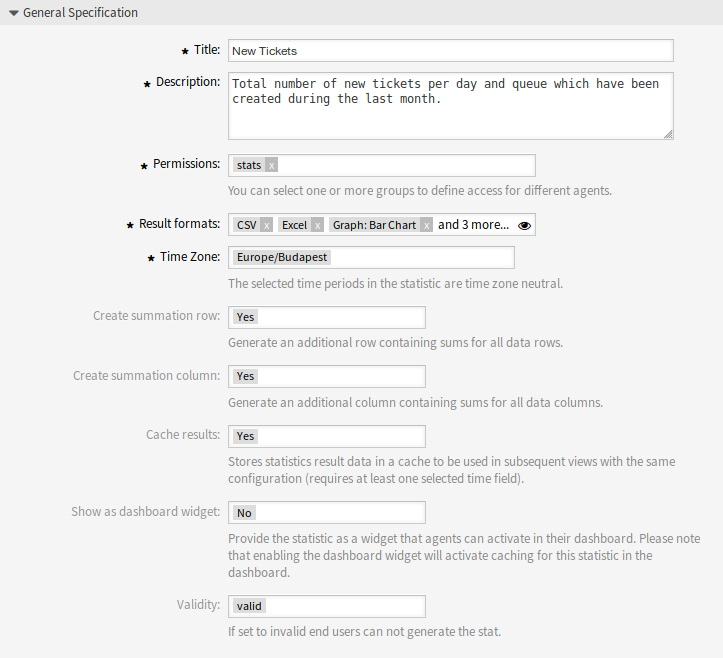
Edit General Specification Section
To import a statistics:
- Click on the Import Statistics button in the left sidebar.
- Click on the Browse… button and select a previously exported
.xmlfile. - Click on the Import button.
- Modify the fields and the statistics details.
- Click on the Save or Save and finish button.
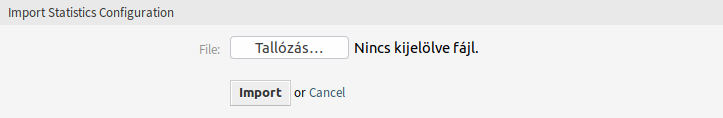
Import Statistics Configuration Screen
To export a statistics:
- Click on the download icon in list of statistics.
- Choose a location in your computer to save the
.xmlfile.
To delete a statistics:
- Click on the trash icon in the list of statistics.
- Click on the OK button in the confirmation screen.
To run a statistics:
- Click on the play icon in list of statistics.
- Review the statistics details.
- Click on the Run now button.

View Statistics Screen
To preview a statistics:
- Go the the edit screen of a statistics.
- See the preview.
- Change the settings to view different type of graphs.
- Change the values of X-axis, Y-axis and Filter with the respective buttons.
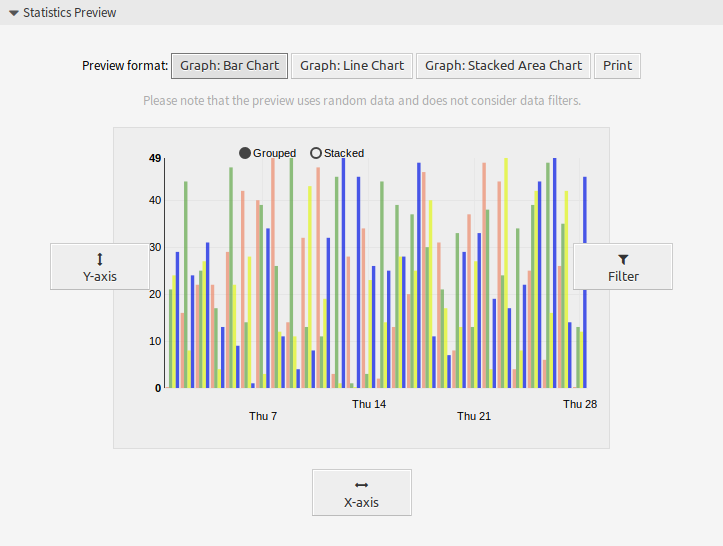
Statistics Preview Widget
Note
The preview uses random data and does not consider data filters.
General Statistics Specification
The following settings are available when adding or editing this resource. The fields marked with an asterisk are mandatory.
- Title *
- The name of this resource. Any type of characters can be entered to this field including uppercase letters and spaces. The name will be displayed in the overview table.
- Description
- Add additional information to this resource. It is recommended to always fill this field as a description of the resource with a full sentence for better clarity, because the comment will be also displayed in the overview table.
- Permissions *
- You can select one or more groups to define access for different agents.
- Result formats *
- You can select, in which format should be able to see the statistics. Possible formats are CSV, Excel, Graph and Print based on the selected statistic type.
- Time Zone *
- The selected time periods in the statistics are time zone neutral.
- Create summation row
- Generate an additional row containing sums for all data rows.
- Create summation column
- Generate an additional column containing sums for all data columns.
- Cache results
- Stores statistics result data in a cache to be used in subsequent views with the same configuration (requires at least one selected time field).
- Show as dashboard widget
Provide the statistics as a widget that agents can activate in their dashboard.
Note
Enabling the dashboard widget will activate caching for this statistics in the dashboard.
- Validity *
- Set the validity of this resource. Each resource can be used in OTRS only, if this field is set to valid. Setting this field to invalid will disable the use of the resource.
Ticket Attributes for Statistics
The following ticket attributes can be included in statistics using the X-axis button, if Dynamic Lists statistics are selected.
See also
Dynamic fields for Ticket object are also listed here. The list of dynamic fields is different in each system and can be reviewed in the Dynamic Fields module of the administrator interface.
- Accounted time
- Accumulated time of the times stored in the articles.
- Age
- The relative age since ticket creation and now.
- Agent/Owner
- The owner agent of the ticket.
- Close Time
- The absolute date and time with timezone when the ticket was closed. This field is empty for open tickets.
- Created
- The absolute date and time with timezone when the ticket was created.
- Customer ID
- The customer of the customer user of the ticket.
- Customer User
- The login name of the customer user of the ticket.
- EscalationDestinationDate
- The absolute date and time with timezone when the ticket is escalated.
- EscalationDestinationIn
- The relative time from the current time to the time of escalation.
- EscalationResponseTime
- Unix timestamp of response time escalation.
- EscalationSolutionTime
- Unix timestamp of solution time escalation.
- EscalationTime
- The total time in seconds until escalation of nearest escalation time type: response, update or solution time.
- EscalationTimeWorkingTime
- The time in seconds within the defined working time or service time until an escalation.
- EscalationUpdateTime
- Unix timestamp of update time escalation.
- First Lock
- The absolute date and time with timezone when the ticket was locked first. This field is empty for tickets, that are not locked yet.
- FirstResponse
- The timestamp of first response.
- FirstResponseDiffInMin
The difference in minutes between the specified response time and the actual response time.
This time is suitable to get an overview about the past and shown for open and closed tickets.
- FirstResponseInMin
The time in minutes from ticket creation to first response (based on working time).
This time is suitable to get an overview about the past and shown for open and closed tickets.
- FirstResponseTime
The total time in seconds until the first response time escalation.
This time is only suitable to get an overview about the current situation because it is shown only for open tickets.
- FirstResponseTimeDestinationDate
The absolute date of a first response time escalation.
This time is only suitable to get an overview about the current situation because it is shown only for open tickets.
- FirstResponseTimeDestinationTime
The escalation time as Unix timestamp.
This time is only suitable to get an overview about the current situation because it is shown only for open tickets.
- FirstResponseTimeEscalation
- Indicates whether the ticket has escalated or not.
- FirstResponseTimeNotification
- Indicates whether the defined escalation notification time is activated or not.
- FirstResponseTimeWorkingTime
The time in seconds within the defined working time or service time until an escalation of a first response.
This time is only suitable to get an overview about the current situation because it is shown only for open tickets.
- Last Changed
- The absolute date and time with timezone when the ticket was changed.
- Lock
- The lock state of the ticket.
- Number
- An auto-increment integer number in the output to show the line numbers.
- Number of Articles
- The number of articles in the ticket.
- Priority
- The priority of the ticket.
- Queue
- The queue in which the ticket is located.
- RealTillTimeNotUsed
- Unix timestamp of pending time.
- Responsible
- The responsible agent of the ticket.
- Service
- The service of the ticket. If no service is assigned, this field is empty.
- SLA
- The SLA of the ticket. If no SLA is assigned, this field is empty.
- SLAID
- The ID of the SLA of the ticket. If no SLA is assigned, this field is empty.
- SolutionDiffInMin
The difference in minutes between the specified solution time and the actual solution time.
This time is suitable to get an overview about the past and shown for open and closed tickets.
- SolutionInMin
The total time in minutes until a solution time escalation.
This time is suitable to get an overview about the past and shown for open and closed tickets.
- SolutionTime
The total time in seconds until a solution time escalation.
This time is only suitable to get an overview about the current situation because it is shown only for open tickets.
- SolutionTimeDestinationDate
The absolute date of a solution time escalation.
This time is only suitable to get an overview about the current situation because it is shown only for open tickets.
- SolutionTimeDestinationTime
The solution time escalation as Unix timestamp.
This time is only suitable to get an overview about the current situation because it is shown only for open tickets.
- SolutionTimeEscalation
- Indicates whether the ticket has escalated or not.
- SolutionTimeNotification
- Indicates whether the defined escalation notification time is activated or not.
- SolutionTimeWorkingTime
The time in seconds within the defined working time or service time until a solution time escalation.
This time is only suitable to get an overview about the current situation because it is shown only for open tickets.
- State
- The state of the ticket.
- StateType
- State type of the ticket.
- Ticket#
- The ticket number.
- Title
- The title of the ticket.
- Type
- The type of the ticket.
- UnlockTimeout
- Time until the ticket is automatically unlocked.
- UntilTime
- Total seconds till pending.
- UpdateTime
The total time in seconds until an update time escalation.
This time is only suitable to get an overview about the current situation because it is shown only for open tickets.
- UpdateTimeDestinationDate
The absolute date of an update time escalation.
This time is only suitable to get an overview about the current situation because it is shown only for open tickets.
- UpdateTimeDestinationTime
The update time escalation as Unix timestamp.
This time is only suitable to get an overview about the current situation because it is shown only for open tickets.
- UpdateTimeEscalation
- Indicates whether the ticket has escalated or not.
- UpdateTimeNotification
- Indicates whether the defined escalation notification time is activated or not.
- UpdateTimeWorkingTime
The time in seconds within the defined working time or service time until an update time escalation.
This time is only suitable to get an overview about the current situation because it is shown only for open tickets.